
Sample State Farm Agency
|
|
|
|
Copyright © 2014 MICOS Group L.L.C.,
all rights reserved. All materials appearing on this page and website may
not be reproduced or stored in a retrieval system without prior written
permission of the publisher. |
|
|
|
|
|
|
|
|
|
|
|

State Farm/Sample Agency is in the process of being formed as an insurance agency owned and operated by State Farm. This plan is written as a guide for financing, start-up and management of this new agency and will also serve as the basis for measurement. The following is a summary of the main points of this plan.
- The objectives of State Farm/ Sample Agency are to generate a profit, grow at a challenging and manageable rate, and to be a good citizen in the community.
- The mission of State Farm/ Sample Agency is to provide products and services with high quality, protection and value pricing.
- The keys to success for State Farm/Sample Agency are variety of business services and products, personal contact, timely and accurate service, development of one-to-one relationships, and a reputation of honesty and integrity.
- The primary products offered will be from State Farm Insurance Company, and the added value to small businesses will be the investment, savings and other financial services offered.
- The local market for this business is wide open. State Farm Insurance Company has captured 23% of the market share and is considered the second largest insurance company in Stark County.
- In the first year of operation, a customer base is being established. Over 85% of the new and established insurance business will renew each year creating compounding growth in sales of over 20% with limited increase in operational expense.
In conclusion, as shown in the highlights chart below, this plan projects rapid growth over the next three years with a profit forecasted in the second year of operation and continuing into future years of operation. Implementing this plan, will ensure that State Farm/
Sample Agency becomes a profitable venture. |
Highlights
 |
|
|
The main objectives of State Farm/Sample Agency are:
- Profit - to create enough prosperity for the agency and employees to have a secure and profitable career with State Farm.
- Growth - to grow the business at a rate that is both challenging and manageable.
- Citizenship - to be a social asset to the community and contribute to others who are less fortunate.
|
|
|
State Farm/
Sample Agency is dedicated to providing insurance products and business services that provide high quality, protection, and value pricing. We wish to establish a successful partnership with our clients that respects their interests and goals.
Success will be measured by our clients choosing us because of their belief in our ability to meet or exceed their expectations of price, service, and expertise. |
|
|
The keys to the success for State Farm/Sample Agency are:
Business Analysis
Strengths
- 20 years of knowledge, experience and familiarity of Stark County
- Strong rapport with local citizens & corporate decision makers
Weaknesses
- Demographic office visibility
Competition
- Primary competition is local State Farm Agents, Farmers & Allstate and other Insurance companies catering to Stark County Market
Unique Agency Opportunities
- Well recognized community events
Educational Institutions- several high schools, Stark Tech, Walsh
Healthcare Institutions- hospitals, long-term care facilities, adult daycare
73% of focus population own their own home |
|
|
State Farm/Sample Agency is located in Canton, OH providing insurance, investment, banking and retirement products to individuals, families, and small businesses. |
|
|
State Farm/Sample Agency will operate as an Independent Contractor the first 12 months under the ownership of State Farm Insurance Company. Born and raised in Massillon, OH, the
agent is closely familiar with Stark County and Northeast Ohio.
She has over 20 years of experience in Sales, Healthcare, Management, and Consulting and is recently pursuing her insurance agent license for Life, Health, Property and Casualty insurance.
|
|
|
State Farm/Sample Agency start-up costs include:
Start-up costs come to $21,600 of which $18,000 is being financed by State Farm's Signing Bonus. In the first six months of operation:
- Marketing/Lead Services: marketing and lead generation services to establish client base
- 1st Month Payroll: for personnel & clerical services
- Office Sign: professionally developed business sign for business recognition in the market place
Stationary: the printing of letterhead and envelopes with the Agency & State Farm company logo
Business Cards: the printing of business cards with Agency & State Farm company logo
Brochures: development and printing of brochures for marketing the business
Cell Phone and Pager: business cell phone and pager for communication with the clients at all times
Office Supplies: supplies necessary to set up an office
Training/Licensing: costs associated with the three state licenses required for insurance business
Business Associations: membership into several business associations such as Chamber of Commerce
1st Month Rent/Lease: for agency office space
1st Month Utilities: for agency office utilities
Telephone: for agency telephone & broadband services
Postage: for agency mailings
State Farm/Sample Agency long-term assets include:
- Laptop Computer: used in meetings with clients for printing insurance quotes and on-line applications
- PC Computer/Monitor: used in office for accounting services and record of business transactions
- Printer/Copier/Scanner:
used in office for business transactions. $18,000 sign-up bonus is being used towards the start-up costs. In May of 2008 an additional $11,000 in financing will be required to ensure business operations, marketing and stability during the first year of operation.
|
| Start-up |
| | |
| Requirements | |
| | |
| Start-up Expenses | |
| Marketing/Lead Services | $500 |
| 1st Month Payroll | $4,600 |
| Office Sign | $500 |
| Stationary | $100 |
| Business Cards | $50 |
| Marketing Brochures | $200 |
| Cell Phone | $100 |
| Office Supplies | $450 |
| Office Furniture | $1,000 |
| 1st Month Rent/Lease | $2,000 |
| 1st Month Utilities | $400 |
| Postage | $400 |
| Telephone/Broadband | $300 |
| Total Start-up Expenses | $10,600 |
| | |
| Start-up Assets | |
| Cash Required | $11,000 |
| Other Current Assets | $0 |
| Long-term Assets | $0 |
| Total Assets | $11,000 |
| | |
| Total Requirements | $21,600 |
|
Start-up
 |
|
|
State Farm/Sample Agency provides insurance, banking, savings and retirement products to individuals, families, and small businesses.
As an agent of State Farm Insurance Company the following product and services are offered:
- Personal Lines - auto, renters, home, motorcycle, boat/yacht, snowmobile, jet ski etc.
- Commercial Lines - businesses, workers compensation, surety bonds
- Life & Disability Products - term, whole, universal group and variable life and annuities
- Health Insurance -
long-term care, disability, supplemental medical insurance,
Medicare supplemental
- Retirement Products - fixed, equity indexed, and variable annuities, mutual funds
- Retirement Plans - IRA, Roth IRA, pension plans, SEP plans, SIMPLE plans, 401K, Profit Sharing
- Life Planning Concepts - Education Savings Accounts, College Savings Plan
- Deposit Products - CDs, Money Markets, Savings Accounts, Checking Accounts, HSAs, IRAs
- Loan Products - Vehicle Loans, Mortgage Loans, Home Equity Loans & Lines of Credit, Credit Cards
|
|
|
The market area for State Farm/Sample Agency will be focused on Stark County. Stark County is experiencing an average growth in population over the 2000 census of .06%.
As of 2007, the State Farm Insurance Company is the largest insurance company in Stark County with 23% of the market share. The overall market for State Farm/Sample Agency is wide open. This business plan has identified over 380,575 individuals and business as potential clients in the market area. |
|
|
State Farm/Sample Agency has targeted the following market segments:
The available market share of 77% represents the estimated market that State Farm Insurance has not captured at this time. Although, the entire state is an available marketing area, the Stark County area will be the focus marketing area at this time.
The first and most important market segment is population broken down by age groups. This can be used for determining the market for personal lines of insurance such as auto and various recreational vehicles, life and life planning products.
Note that the population of 18 to 24 year olds has been separated from the available population as a market segment in itself for determining the possibility of high risk auto insurance policies.
The second market segment is housing units broken down by owner occupied and renters. This can be used for determining the market for personal lines of insurance such as home, town homes, condominium, renters and mortgage protection.
The third market segment is businesses with less than 20 employees. This can be used for determining the market for accounting and bookkeeping services and commercial lines of insurance including property and casualty, retirement and workers compensation.
| |
Ohio |
|
Stark County |
|
Available market Share 77% |
| YR 2007 Estimate-Total Population |
11,478,006 |
|
380,575 |
|
293,043 |
|
|
|
|
|
|
| YR 2007 Estimate-18 to 24 years old |
|
|
31,379 |
|
24,162 |
| YR 2007 Estimate-25 to 44 years old |
|
|
105,259 |
|
81,049 |
| YR 2007 Estimate-45 to 64 years old |
|
|
90,512 |
|
69,694 |
| YR 2007 Estimate-65 years and more |
|
|
57,200 |
|
44,044 |
|
|
|
|
|
|
| YR 2007 Estimate-Total Housing Units |
|
|
148,000 |
|
113,960 |
| Housing Units-Owner Occupied |
|
|
107,397 |
|
82,696 |
| Housing Units-Renters |
|
|
40,919 |
|
31,508 |
|
|
|
|
|
|
| YR 2007 Estimate- Businesses |
|
|
9,277 |
|
7,143 |
|
|
|
|
|
|
|
|
|
|
|
|
| 2007 Major City Population Estimates |
|
|
|
|
|
| Canton |
|
|
79,905 |
|
61,527 |
| Jackson |
|
|
39,798 |
|
30,644 |
| Plain |
|
|
34,607 |
|
26,647 |
| Massillon |
|
|
32,055 |
|
24,682 |
| Perry |
|
|
28,700 |
|
22,099 |
| Lake |
|
|
23,558 |
|
18,140 |
| Alliance |
|
|
23,210 |
|
17,872 |
| North Canton |
|
|
16,796 |
|
12,933 |
| Louisville |
|
|
9,294 |
|
7,156 |
The Top Employers in the area are:
| Aultman Hospital |
| Canton City Bd of Ed |
| General Electric Co |
| Mercy Medical Center |
| Precision Castparts Corp |
| Republic Engineered Products |
| Timken Co |
| Wal-Mart Stores Inc | |
| Market Analysis |
| | | 2008 | 2009 | 2010 | 2011 | 2012 | |
| Potential Customers | Growth | | | | | | CAGR |
| Focus Population (Ages 18 & Older) | 1% | 291,520 | 292,978 | 294,443 | 295,915 | 297,395 | 0.50% |
| Median Household Income | 2% | $41,180 | $42,004 | $42,844 | $43,701 | $44,575 | 2.00% |
| Focus Housing Units (Owned) | 0% | 107,397 | 107,397 | 107,397 | 107,397 | 107,397 | 0.00% |
| Focus Housing Units (Rented) | 1% | 40,919 | 41,328 | 41,741 | 42,158 | 42,580 | 1.00% |
| Median Housing Value | 0% | $100,300 | $100,300 | $100,300 | $100,300 | $100,300 | 0.00% |
| Median Age | 2% | 38 | 38 | 39 | 40 | 41 | 2.12% |
| Unemployment Rate | 0% | 7 | 7 | 7 | 7 | 7 | 1.48% |
| Private nonfarm business establishments, 2005 | 1% | 9,277 | 9,370 | 9,464 | 9,559 | 9,655 | 1.00% |
| Total | 0.48% | 590,637 | 593,422 | 596,235 | 599,077 | 601,950 | 0.48% |
|
Market Analysis (Pie)
.jpg) |
|
|
- Emphasize value instead of price. State Farm/Sample Agency is dedicated to working closely with each client and educating them on the importance of value over price.
- Build long term relationships. State Farm/Sample Agency is dedicated to establishing a successful partnership with each client, respecting their interests and goals by cultivating a long term relationship to enhance client retention.
- Focus on increasing market share. State Farm/Sample Agency will focus on personal and business clients that have been identified in the targeted markets.
|
|
|
State Farm/Sample Agency's competitive edge is our positioning as strategic ally with our clients, who are clients more than customers. By building a business based on long-standing relationships with satisfied clients, we simultaneously build defenses against competition. The longer the relationship stands, the more we help our clients understand what we offer them and why they need it. |
|
|
The marketing strategy is the core of State Farm/Sample Agency's main strategy:
- Emphasize, and educate the client on, the importance of value over price
- Build a relationship business that fosters client retention
- Develop specific programs for each target market segment
Production Goals
| |
|
|
|
|
|
|
| Assigned Auto |
99 |
|
|
1190 |
$57,501 |
|
|
Assigned Fire |
58 |
|
|
700 |
$21,000 |
|
|
|
|
|
|
|
|
|
|
|
Monthly Team Goal |
Top 100 Minimum |
Monthly Stretch Goal |
Policies |
Compensation |
|
|
Produced Auto |
30 |
35 |
40 |
360 |
$17,395 |
|
|
Produced Fire |
23 |
|
30 |
270 |
$8,100 |
|
|
Produced Life |
10 |
$3100 Premiums |
15 |
120 |
$18,780 |
|
|
Produced Health |
2 |
$1500 Premiums |
5 |
20 |
$2,814 |
|
|
Produced Bank Loans & CC |
2 |
|
5 |
18 |
$5,000 |
|
|
Produced Bank Deposits |
2 |
$300 Bank Commissions |
5 |
18 |
$1,000 |
|
|
Mutual Funds |
2 |
4 |
6 |
28 |
$2,800 |
|
|
Semi-Monthly Auto |
129 |
|
115 |
1550 |
$14,043 |
|
|
Semi-Monthly Fire |
81 |
|
62 |
970 |
$5,456 |
|
|
Semi-Monthly Life & BD |
10 |
|
15 |
125 |
$9,390 |
|
|
|
|
|
|
|
|
|
|
Agent Scorecard Bonus |
Premium/Policy Goal |
|
|
Points |
|
|
|
Total Life Scorecard |
$2,800 |
|
|
25 |
|
|
|
Total Health Scorecard |
$940 |
|
|
25 |
|
|
|
Total Bank Scorecard |
$285 |
|
|
25 |
|
|
|
Total Auto/Fire Scorecard |
30 Auto & 23 Fire |
|
|
100 |
|
|
|
Total Scorecard Bonus |
|
|
|
|
$34,500 |
|
|
|
|
|
|
|
|
|
|
|
|
|
|
|
|
|
|
|
|
|
|
| Auto/Fire/Life Production |
10-20% Increase |
|
|
|
|
|
| 3 Lines per Household |
25% Increase |
|
|
|
|
|
| Policies per Household |
4 |
|
|
|
|
|
| Lapse or
Cancellation Ratio |
Below 10% |
|
|
|
|
|
|
|
|
|
|
|
|
|
|
|
|
|
|
|
| Sales Agent Asst. will be compensated on produced sales with commissions based on the following rates: |
|
|
|
|
|
|
|
|
|
| |
Commission Rate |
Yearly Production Goal |
Potential Commission |
|
|
|
| Produced Auto |
1.50% |
90 |
$820.00 |
|
|
|
|
Produced Fire |
1.50% |
68 |
$380.00 |
|
|
|
|
Produced Life |
6.50% |
30 |
$1,225.00 |
|
|
|
|
Produced Health |
7.50% |
5 |
$183.00 |
|
|
|
|
Auto Loan |
$2-$10 |
1 |
$6.00 |
|
|
|
|
Mortgage Loan |
$15-$45 |
1 |
$30.00 |
|
|
|
|
Refinance |
$8 |
1 |
$8.00 |
|
|
|
|
HELOC |
$6 |
1 |
$6.00 |
|
|
|
|
Credit Card |
$2 |
1 |
$2.00 |
|
|
|
|
Mutual Funds |
0.50% |
7 |
$700.00 |
|
|
|
|
|
|
$3,360.00 |
|
|
|
|
|
|
|
|
|
|
|
|
|
|
|
|
|
Agency & Team Production & Marketing Strategy
One line searches without auto or without fire monthly
- See multi-line discount program
Small Business Prospecting
- Identify and visit 5 business owners per month
- Follow up calls
- Add at least 1 new small business per month
Renters Prospecting
- Identify and visit 3 rental complexes per month
- Mail rental brochure to occupants and/or leave with rental office managers
Referrals
- Best way to access prospective clients. Always ask current policy holders and develop key centers of influence. $10 gift card for referrals
Door Hangers in Targeted Subdivisions
Advertise in Subdivision Newsletters
Term Conversions
- Life Policy must be one year old before it can be converted
- Send Postcard
- Follow up call one week later
- Explain why they should convert: Permanent is like ownership... Permanent builds cash value
- Goal to convert at least 40%
Auto Loan Program
- Quote: You may not be aware of this but we can provide competitive Auto Financing
- Change: What car financing rate are you currently paying? May I share our great rates with you?
- Total Loss: Before you buy or look for a replacement vehicle, remember we offer competitive rates for auto financing
- Adding: We provide very competitive auto financing rates. May I share our great rates with you?
Used Vehicle Loan Brochures
- Hand one to everyone who enters the office with rates attached.
- Include with outgoing mail
Purchased Leads- Sales Genie, Choicepoint, MANTA
- Identify, mail postcards and follow up on 4000 leads per month
Multi-Line Discount Program
- Mail multi-line postcards to all one-line policy holders
- 2 weeks later follow up with additional multi-line postcards
- Call a minimum of 5 policy holders from auto only list each day
- Send out letter annual premiums before calling giving differences without an additional line
- Notate all policy holders for recalls
- If calling clients within our book of business, we should be able to convert one line to two or more lines 50% of the time.
Agency & Team Retention Marketing Strategy
Transfers In
- Send welcome letter and address labels
Referrals
- Develop relationships with realtors, mortgage brokers, developers, auto body shops, car rental agencies and others who can refer clients
- Keep track of all key business contacts and referrals
- Thank you notes
New Phone Hook ups
- Postcard mailers
- Mail rental brochure to occupants and/or leave with rental office Develop
- Follow up calls
New homeowner Leads
- Courthouse record vendor to identify leads one year after purchase
- Mail New Homeowner letter
- Follow up calls
Defector Letters
- Send personal letters to Develop who have left in the past 2 years
Lapse/Cancellation
Seasonal Labels
- Mail two sheets of labels to each client in October for Holiday Season
Calendars
- Order calendars (magnetic, business card, and wall)
- Give calendars out to Cancellation during month of December (one per family)
Give Aways
- Candy
- Gum
- Jay Gripper
- SF suckers
- City Maps
- ID Card Holders
- SF Pens
- SF Road Atlases
- SF Rules of The Road
Large Clients
- Gifts during holidays (blankets, umbrellas, chairs, gas cards)
Stark County Advertising
- Participate in multi-agent advertising along with any Co-op campaigns
Yellow Page Advertising
MICOS Group Local Internet Traffic Advertising
- Yahoo & Google Local Search listings
- MANTA and Craig's Lists Advertising
Agency & Team Marketing Review Process
- Use Microsoft Outlook Calendar and Task functions for entire team planning
- Bi-weekly team meetings & Bi-weekly individual meetings
- Full day planning sessions in October for strategic planning on following year's goals and training
- All team members are expected to communicate openly and work together to achieve goal
- Each team member will have their own State Farm Handbook, Procedure/Policies Manual and Company Mission Statement at their desk
|
|
|
State Farm/Sample Agency's sales strategy will be based on systematic person-to-person contacts through referrals, direct mail, telemarketing and the Internet. A list of potential prospects has already been compiled and will serve as a launching pad for marketing the products and services. |
|
|
The important elements of the sales forecasts are summarized on two line items, Insurance Sales, and Miscellaneous Revenue. The summary of the initial sales forecast indicates a first year revenue of $193,996 increasing to $233,350
by the end of the second year, then $277,427 by the end of the third year. It should be noted that although sales increase each year, all revenue has been forecasted very conservatively for the three year forecast. Actual sales growth for the second year is 20% due to adding a producer for continued sales growth and exponential growth of insurance renewals. The third year of sales reflects an actual growth of 19% due mostly to the increase in insurance renewals. Each element will be discussed separately and in its entirety below:
Insurance Sales - are comprised of three categories, 1) insurance-produced sales, 2) insurance-assigned sales and 3) Insurance renewals. The insurance products used to forecast new sales are, auto and high risk auto (renews every six months), property structures such as homes, over stated, condominiums, renters and landlord insurance, commercial, life and all other types of recreation vehicle insurance, (renews annually).
What makes insurance sales different from other sales are the assigned sales and renewals. In most cases, without an increase in monthly production, the monthly income will almost double due to renewals. It has been determined by industry averages, State Farm customer loyalty in the first year is 80%, second year is 85% and third year is 89%. Other than auto, which renews every six months, all other insurance products renew on an annual basis. Because of renewals, it is possible to almost double sales revenue without increasing production costs. The following is the monthly forecast:
| Sales Forecast |
|
|
|
|
|
|
|
|
|
|
|
|
| |
May |
Jun |
Jul |
Aug |
Sep |
Oct |
Nov |
Dec |
Jan |
Feb |
Mar |
Apr |
| Sales |
|
|
|
|
|
|
|
|
|
|
|
|
| |
|
|
|
|
|
|
|
|
|
|
|
|
| Assigned Auto |
$4,792 |
$4,792 |
$4,792 |
$4,792 |
$4,792 |
$4,792 |
$4,792 |
$4,792 |
$4,792 |
$4,792 |
$4,792 |
$4,792 |
| Assigned Fire |
$1,750 |
$1,750 |
$1,750 |
$1,750 |
$1,750 |
$1,750 |
$1,750 |
$1,750 |
$1,750 |
$1,750 |
$1,750 |
$1,750 |
| Produced Auto |
$348 |
$348 |
$522 |
$522 |
$870 |
$870 |
$1,740 |
$1,740 |
$2,609 |
$2,609 |
$2,609 |
$2,609 |
| Produced Fire |
$162 |
$162 |
$243 |
$243 |
$405 |
$405 |
$810 |
$810 |
$1,215 |
$1,215 |
$1,215 |
$1,215 |
| Produced Life |
$376 |
$376 |
$563 |
$563 |
$939 |
$939 |
$1,878 |
$1,878 |
$2,817 |
$2,817 |
$2,817 |
$2,817 |
| Produced Health |
$56 |
$56 |
$84 |
$84 |
$141 |
$141 |
$281 |
$281 |
$422 |
$422 |
$422 |
$422 |
| Produced Bank Loans & CC |
$100 |
$100 |
$150 |
$150 |
$250 |
$250 |
$500 |
$500 |
$750 |
$750 |
$750 |
$750 |
| Produced Bank Deposits |
$20 |
$20 |
$30 |
$30 |
$50 |
$50 |
$100 |
$100 |
$150 |
$150 |
$150 |
$150 |
| Mutual Funds |
$56 |
$56 |
$84 |
$84 |
$140 |
$140 |
$280 |
$280 |
$420 |
$420 |
$420 |
$420 |
| Semi-Monthly Auto |
$982 |
$982 |
$982 |
$982 |
$982 |
$982 |
$982 |
$982 |
$982 |
$982 |
$982 |
$982 |
| Semi-Monthly Fire |
$328 |
$328 |
$328 |
$328 |
$328 |
$328 |
$328 |
$328 |
$328 |
$328 |
$328 |
$328 |
| Semi-Monthly Life & BD |
$783 |
$783 |
$783 |
$783 |
$783 |
$783 |
$783 |
$783 |
$783 |
$783 |
$783 |
$783 |
| Total Agent Scorecard Bonus |
|
|
|
|
|
|
|
|
|
|
|
$34,500 |
| Totals |
$9,752 |
$9,752 |
$10,311 |
$10,311 |
$11,428 |
$11,428 |
$14,223 |
$14,223 |
$17,017 |
$17,017 |
$17,017 |
$17,017 |
The following is the yearly forecast:
|
|
|
|
|
| Sales Forecast |
|
|
|
|
| |
FY 2009 |
FY 2010 |
FY 2011 |
|
| Sales |
|
|
|
|
| |
|
|
|
|
| Assigned Auto |
$57,501 |
$74,896 |
$94,379 |
|
| Assigned Fire |
$21,000 |
$29,100 |
$38,172 |
|
| Produced Auto |
$17,395 |
$19,483 |
$21,821 |
|
| Produced Fire |
$8,100 |
$9,072 |
$10,161 |
|
| Produced Life |
$18,780 |
$21,034 |
$23,558 |
|
| Produced Health |
$2,814 |
$3,152 |
$3,530 |
|
| Produced Bank Loans & CC |
$5,000 |
$5,600 |
$6,272 |
|
| Produced Bank Deposits |
$1,000 |
$1,120 |
$1,254 |
|
| Mutual Funds |
$2,800 |
$3,136 |
$3,512 |
|
| Semi-Monthly Auto |
$11,778 |
$13,191 |
$14,774 |
|
| Semi-Monthly Fire |
$3,938 |
$4,410 |
$4,939 |
|
| Semi-Monthly Life & BD |
$9,390 |
$10,517 |
$11,779 |
|
| Total Agent Scorecard Bonus |
$34,500 |
$38,640 |
$43,277 |
|
| Totals |
$193,996 |
$233,350 |
$277,427 |
|
|
|
|
|
| |
| Sales Forecast |
| | FY 2009 | FY 2010 | FY 2011 |
| Sales | | | |
| Assigned Auto | $57,501 | $74,896 | $94,379 |
| Assigned Fire | $21,000 | $29,100 | $38,172 |
| Produced Auto | $17,396 | $19,483 | $21,821 |
| Produced Fire | $8,100 | $9,072 | $10,161 |
| Produced Life | $18,780 | $21,034 | $23,558 |
| Produced Health | $2,814 | $3,152 | $3,530 |
| Produced Bank Loans & Credit Cards | $5,000 | $5,600 | $6,272 |
| Produced Bank Deposits | $1,000 | $1,120 | $1,254 |
| Mutual Funds | $2,800 | $3,136 | $3,512 |
| Semi-Monthly Auto | $11,778 | $13,191 | $14,774 |
| Semi-Monthly Fire | $3,938 | $4,410 | $4,939 |
| Semi-Monthly Life & Business
Development | $9,390 | $10,517 | $11,779 |
| Agent Scorecard Bonus | $34,500 | $38,640 | $43,277 |
| Total Sales | $193,997 | $233,351 | $277,428 |
| | | | |
| Direct Cost of Sales | FY 2009 | FY 2010 | FY 2011 |
| Sales Agent Assistant Salary (Full-time) | $16,640 | $17,140 | $17,655 |
| Sales Agent Assistant (Commission) | $3,360 | $3,700 | $4,070 |
| Office Manager/Marketing (Full-time) | $35,360 | $36,420 | $37,500 |
| Subtotal Direct Cost of Sales | $55,360 | $57,260 | $59,225 |
|
Sales Monthly
 |
Sales by Year
 |
|
|
|
6 Months prior to Grand Opening
60 days after Grand Opening
1 year after Grand Opening
- A wide variety of business services and insurance products those are affordable, available and understandable.
- Personal contact and service that meets or exceeds the expectations of our clients.
- Services and products that are delivered with accuracy and timeliness.
- Relationships with our clients that fosters renewal business.
- A reputation in the community for its honesty and integrity.
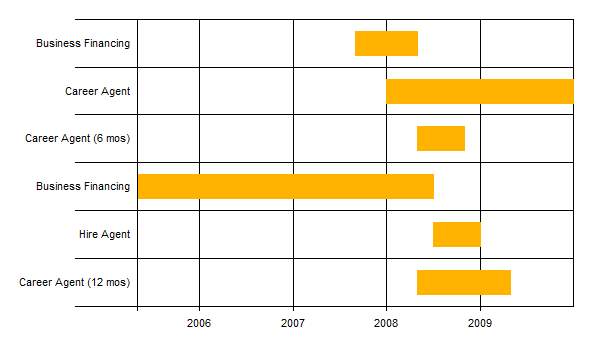
The table below
lists important program milestones, with dates and managers in charge. The
milestone schedule indicates
State
Farm/Sample Agency's
emphasis on planning for implementation and the measurement of these activities.
In addition, each milestone is important to achieving the financial forecast
used in this business plan. The following is a brief description of each
milestone:
-
12/2/2007- Agency position accepted. Compensation proposal accepted &
resignation of current employment with minimum 2 weeks notice.
-
December 2007- Official training begins in Murfreesboro, TN.
-
12/01/07-4/30/08- Ongoing training begins.... IE: Agency visits and any other
applicable training
-
05/01/08- Official Sample State Farm Agency Grande opening.
-
05/01/08- $18,000 Signing Bonus paid.
-
5/01/08-5/31/08- Hire Sales Agent Asst - hire and train new agent for a start
date of 6/01/08.
-
07/01/08 - Staffing in place. Production goals in place. Marketing strategy in
place. Full implementation of all Marketing & Sales Strategies.
-
05/01/08-04/30/09- State Farm Career Agent (12 months) - the next milestone in
the State Farm Career Agent Program. At the end of twelve months, a State Farm
independent contractor's production is checked for the number of policies
issued-and-paid to determine State Farm Agency Contract.
|
| Milestones |
| | | | | | |
| Milestone | Start Date | End Date | Budget | Manager | Department |
| Business Financing | 9/1/2007 | 4/30/2008 | $0 | Owner | Finance |
| Career Agent | 1/1/2008 | 12/31/2009 | $0 | Owner | Marketing |
| Career Agent (6 mos) | 5/1/2008 | 10/31/2008 | $0 | Owner | Marketing |
| Business Financing | 5/1/2005 | 6/30/2008 | $0 | Owner | Finance |
| Hire Agent | 7/1/2008 | 12/31/2008 | $0 | Owner | Administrative |
| Career Agent (12 mos) | 5/1/2008 | 4/30/2009 | $0 | Owner | Marketing |
| Totals | | | $0 | | |
|
Milestones & Business Goals
 |
|
|
The management philosophy of State Farm/Sample Agency is based on respect for every client, and individual responsibility. For the first year the employee base will be the agent, Cindy Scott plus an office manager and sales agent assistant. In May of 2007 the financial forecast supports the hiring of an insurance agent assistant to help increase the growth of the business.
State Farm/Sample Agency's intention is to hire only those who demonstrate the qualities necessary for working in a professional environment, and the willingness to move forward in continuing education. We will be hiring the ultimate "people persons" to provide world class service. |
|
|
The Personnel Plan reflects the staffing levels required to create, and establish the customer base needed to achieve the revenues projected and reach profitability.
All insurance sales and business service personnel salaries are considered a direct cost of sales.
- Office Manager (Full-time) paid $17 an hour.
- Sales Agent Assistant (Full-time) paid $8 an hour plus commissions.
Personnel Hiring Process
Recruiting
- Actively seek new team members at every opportunity so as to have qualified candidates on hand at all times
- Hand out "I liked your service cards"
- Analyze and review strengths & weaknesses of current team members periodically
Locating Candidates
- Centers of Influence
- Job Fairs
- Advertise in newspapers & internet
- Career Placement Centers
Telephone Screening
- Narrow down pool of candidates
- Consider phone skills, articulation, rapport, personality and job related experience
- Consider sales and technical skills
Preliminary Interview
- Complete Application
- Administer testing
- Explain the position and licensing requirements
- Inform each candidate of mandatory background check
- Send declination letters to those not invited back for structured interview
Structured Interview
- Sample questions available in Structured Interview Guide
- Ask the same questions to each candidate
Job Offer
- After offer acceptance, send declination letters to other candidates
- Notify ASR for the following information:
- New team member alias
- Federal Crime Bill Staff of Certificate Form
- Request to License Agent Staff/Background Check Form
Education & Development
- Every Team member will obtain and maintain P&C and L/H licenses.
- Every team member will draft an individual development plan. Progress will be reviewed and monitored on a quarterly basis.
- Every team member is expected to attend AFO/State Farm sponsored training and other learning opportunities with the agent's approval.
- Specialists will be on a 3 month trainee status
- Will need to obtain and exceed all production goals.
|
| Personnel Plan |
| | FY 2009 | FY 2010 | FY 2011 |
| Agent | $0 | $0 | $0 |
| Sales Agent Assistant | $0 | $0 | $0 |
| Office Manager | $0 | $0 | $0 |
| Total People | 3 | 3 | 3 |
| | | | |
| Total Payroll | $0 | $0 | $0 |
|
|
|
State Farm/Sample Agency financial plan is based on obtaining a signing bonus by May of 2008 of $18,000 to cover the start-up expenses. In May of 2008 an additional $3,500 in financing will be required to ensure business operations, marketing and stability during the first year of operation. For financial forecasting the $7,000 in additional financing will be acquired by the personal savings account of Cindy Scott. State Farm/Sample Agency will achieve 28.2% profitability in second year and a 46.7% profitability in the third year.
The fiscal year is a calendar year, January through December. |
|
|
Start-up costs come to $21,600 of which $18,000 is being financed by State Farm's signing bonus. Before the first six months of operation, $10,600 financing is being sought for the start-up costs. In May of 2008 an additional $11,000 in financing will be required to ensure business operations, marketing and stability during the first year of operation.
|
| Start-up Funding |
| Start-up Expenses to Fund | $10,600 |
| Start-up Assets to Fund | $11,000 |
| Total Funding Required | $21,600 |
| | |
| Assets | |
| Non-cash Assets from Start-up | $0 |
| Cash Requirements from Start-up | $11,000 |
| Additional Cash Raised | $0 |
| Cash Balance on Starting Date | $11,000 |
| Total Assets | $11,000 |
| | |
| | |
| Liabilities and Capital | |
| | |
| Liabilities | |
| Current Borrowing | $0 |
| Long-term Liabilities | $0 |
| Accounts Payable (Outstanding Bills) | $0 |
| Other Current Liabilities (interest-free) | $0 |
| Total Liabilities | $0 |
| | |
| Capital | |
| | |
| Planned Investment | |
| Owner | $3,600 |
| State Farm Signing Bonus | $18,000 |
| Additional Investment Requirement | $0 |
| Total Planned Investment | $21,600 |
| | |
| Loss at Start-up (Start-up Expenses) | ($10,600) |
| Total Capital | $11,000 |
| | |
| | |
| Total Capital and Liabilities | $11,000 |
| | |
| Total Funding | $21,600 |
|
|
|
The key underlying assumptions of State Farm/Sample Agency financial plan shown in the following general assumption table are:
- We assume access to financing of $21,600 to support our financial plan.
- We assume our financial progress is based on a very conservative sales forecast supported by data received and reviewed by State Farm Insurance.
- We assume that all sales milestones have been achieved.
|
| General Assumptions |
| | FY 2009 | FY 2010 | FY 2011 |
| Plan Month | 1 | 2 | 3 |
| Current Interest Rate | 8.25% | 8.32% | 8.32% |
| Long-term Interest Rate | 8.25% | 8.32% | 8.32% |
| Tax Rate | 25.00% | 25.00% | 25.00% |
| Other | 0 | 0 | 0 |
|
|
|
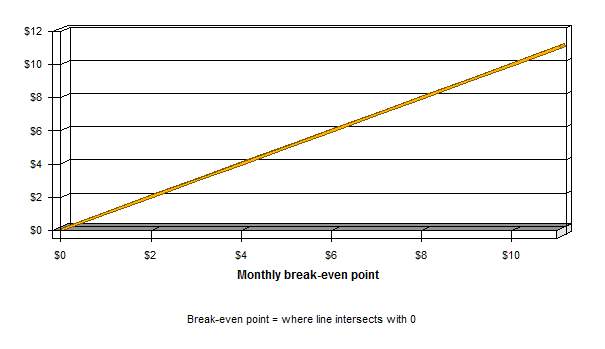
The first year due to start-up costs and expenses will not be included in the break-even analysis.
For determining the average cost of sales for this break-even analysis the last two years are used, 2008 and 2009, yielding a 59.54% variable cost rate. Cost of sales is the direct labor and payroll taxes of those individuals responsible for producing sales and services.
Fixed costs for this break-even analysis is an average of the two year operating costs resulting in a monthly cost of $4600. Not included in this number is interest and income tax expense.
In order for State Farm/Sample Agency to break-even on a monthly basis, it must produce $11,370 in sales resulting in a cost of sales of $4,600 and 59.54% variable costs. |
| Break-even Analysis |
| | |
| Monthly Revenue Break-even | $11,370 |
| | |
| Assumptions: | |
| Average Percent Variable Cost | 59.54% |
| Estimated Monthly Fixed Cost | $4,600 |
|
Break-even Analysis
 |
|
|
Based on the realistic sales projections and efficient cost control measures in place, State Farm/Sample Agency will achieve minimal profitability in the first year of operation. Monthly profitability is first achieved in November 2009, but due to developing a customer base, the first months of operations reflect a loss. The total net profit for the first year operations, (after interest & taxes) is $44,368 or 23%.
In the second year of operation, sales increased $39,355 or 20.3%, resulting in a net profit, (after tax and interest), of $71,464. This is an increase on the bottom line of $27,096 or 61% over the prior year.
In the third year of operation, sales increased $44,077 or 19%, resulting in a net profit, (after tax and interest), of $101,229 or 37%. This yields an increase on the bottom line of $56,861 or 128% increase in profits over the first year of operations. There are no significant changes in the third year of operations. |
| Pro Forma Profit and Loss |
| | FY 2009 | FY 2010 | FY 2011 |
| Sales | $193,997 | $233,351 | $277,428 |
| Direct Cost of Sales | $55,360 | $57,260 | $59,225 |
| Other Costs of Sales | $0 | $0 | $0 |
| | ------------ | ------------ | ------------ |
| Total Cost of Sales | $55,360 | $57,260 | $59,225 |
| | | | |
| Gross Margin | $138,637 | $176,091 | $218,203 |
| Gross Margin % | 71.46% | 75.46% | 78.65% |
| | | | |
| | | | |
| Expenses | | | |
| Payroll | $0 | $0 | $0 |
| Marketing/Promotion | $20,000 | $20,600 | $21,218 |
| Depreciation | $0 | $0 | $0 |
| Employee Benefits | $5,500 | $5,665 | $5,835 |
| Payroll Taxes | $6,500 | $6,695 | $6,896 |
| Rent | $21,600 | $22,248 | $22,915 |
| Utilities | $3,000 | $3,090 | $3,183 |
| Office Supplies | $3,000 | $3,090 | $3,183 |
| Professional Services | $600 | $618 | $637 |
| Insurance | $1,700 | $1,751 | $1,804 |
| Education/Training | $720 | $742 | $764 |
| Telephone/DSL/Cell | $2,500 | $2,575 | $2,652 |
| Cell Phone | $720 | $742 | $764 |
| Office Furniture | $2,000 | $1,000 | $1,030 |
| Postage | $3,000 | $3,090 | $3,183 |
| Auto | $5,000 | $5,150 | $5,305 |
| Travel | $1,000 | $1,030 | $1,061 |
| Meals/Entertainment | $1,200 | $1,236 | $1,273 |
| Office Cleaning | $720 | $742 | $764 |
| Office Maintenance & Repairs | $720 | $742 | $764 |
| | ------------ | ------------ | ------------ |
| Total Operating Expenses | $79,480 | $80,806 | $83,231 |
| | | | |
| Profit Before Interest and Taxes | $59,157 | $95,285 | $134,972 |
| EBITDA | $59,157 | $95,285 | $134,972 |
| Interest Expense | $0 | $0 | $0 |
| Taxes Incurred | $14,789 | $23,821 | $33,743 |
| | | | |
| Net Profit | $44,368 | $71,464 | $101,229 |
| Net Profit/Sales | 22.87% | 30.63% | 36.49% |
|
Profit Monthly
 |
Profit Yearly
 |
Gross Margin Monthly
 |
Gross Margin Yearly
 |
|
|
Due the fact that State Farm/Sample Agency is a new independent contractor agency of State Farm for the first 12 months, the cash flow for FY2009 is somewhat exaggerated by the instant influx of new capital. Subsequent years however show a healthy growth in cash flow, mainly due to the 20% projected annual increase of insurance, banking and mutual fund products sold. |
Cash
 |
| Pro Forma Cash Flow |
| | FY 2009 | FY 2010 | FY 2011 |
| Cash Received | | | |
| | | | |
| Cash from Operations | | | |
| Cash Sales | $193,997 | $233,351 | $277,428 |
| Subtotal Cash from Operations | $193,997 | $233,351 | $277,428 |
| | | | |
| Additional Cash Received | | | |
| Sales Tax, VAT, HST/GST Received | $0 | $0 | $0 |
| New Current Borrowing | $0 | $0 | $0 |
| New Other Liabilities (interest-free) | $0 | $0 | $0 |
| New Long-term Liabilities | $0 | $0 | $0 |
| Sales of Other Current Assets | $0 | $0 | $0 |
| Sales of Long-term Assets | $0 | $0 | $0 |
| New Investment Received | $0 | $0 | $0 |
| Subtotal Cash Received | $193,997 | $233,351 | $277,428 |
| | | | |
| Expenditures | FY 2009 | FY 2010 | FY 2011 |
| | | | |
| Expenditures from Operations | | | |
| Cash Spending | $0 | $0 | $0 |
| Bill Payments | $129,033 | $169,178 | $175,023 |
| Subtotal Spent on Operations | $129,033 | $169,178 | $175,023 |
| | | | |
| Additional Cash Spent | | | |
| Sales Tax, VAT, HST/GST Paid Out | $0 | $0 | $0 |
| Principal Repayment of Current Borrowing | $0 | $0 | $0 |
| Other Liabilities Principal Repayment | $0 | $0 | $0 |
| Long-term Liabilities Principal Repayment | $0 | $0 | $0 |
| Purchase Other Current Assets | $0 | $0 | $0 |
| Purchase Long-term Assets | $0 | $0 | $0 |
| Dividends | $0 | $0 | $0 |
| Subtotal Cash Spent | $129,033 | $169,178 | $175,023 |
| | | | |
| Net Cash Flow | $64,964 | $64,173 | $102,405 |
| Cash Balance | $75,964 | $140,137 | $242,543 |
|
|
|
The table below presents the balance sheet for State Farm/Sample Agency. This table reflects a positive cash position throughout the period of this financial plan. The minimal net worth is created in the first year due to the start-up costs showing as a small retained earnings. As the balance sheet shows, State Farm/Sample Agency will not have any difficulty meeting their debt obligations as long as the conservative revenue projections are met. |
| Pro Forma Balance Sheet |
| | FY 2009 | FY 2010 | FY 2011 |
| Assets | | | |
| | | | |
| Current Assets | | | |
| Cash | $75,964 | $140,137 | $242,543 |
| Other Current Assets | $0 | $0 | $0 |
| Total Current Assets | $75,964 | $140,137 | $242,543 |
| | | | |
| Long-term Assets | | | |
| Long-term Assets | $0 | $0 | $0 |
| Accumulated Depreciation | $0 | $0 | $0 |
| Total Long-term Assets | $0 | $0 | $0 |
| Total Assets | $75,964 | $140,137 | $242,543 |
| | | | |
| Liabilities and Capital | FY 2009 | FY 2010 | FY 2011 |
| | | | |
| Current Liabilities | | | |
| Accounts Payable | $20,597 | $13,306 | $14,482 |
| Current Borrowing | $0 | $0 | $0 |
| Other Current Liabilities | $0 | $0 | $0 |
| Subtotal Current Liabilities | $20,597 | $13,306 | $14,482 |
| | | | |
| Long-term Liabilities | $0 | $0 | $0 |
| Total Liabilities | $20,597 | $13,306 | $14,482 |
| | | | |
| Paid-in Capital | $21,600 | $21,600 | $21,600 |
| Retained Earnings | ($10,600) | $33,768 | $105,232 |
| Earnings | $44,368 | $71,464 | $101,229 |
| Total Capital | $55,368 | $126,832 | $228,061 |
| Total Liabilities and Capital | $75,964 | $140,137 | $242,543 |
| | | | |
| Net Worth | $55,368 | $126,832 | $228,061 |
|
|
|
The table below presents common business ratios as a reference. Industry Profile comparisons are for Standard Industrial Classification code 6411.0000, Insurance Agents, Brokers and Service as the majority of our revenue comes from insurance sales. |
| Ratio Analysis |
| | FY 2009 | FY 2010 | FY 2011 | Industry Profile |
| Sales Growth | 0.00% | 20.29% | 18.89% | 8.23% |
| | | | | |
| Percent of Total Assets | | | | |
| Other Current Assets | 0.00% | 0.00% | 0.00% | 69.87% |
| Total Current Assets | 100.00% | 100.00% | 100.00% | 94.00% |
| Long-term Assets | 0.00% | 0.00% | 0.00% | 6.00% |
| Total Assets | 100.00% | 100.00% | 100.00% | 100.00% |
| | | | | |
| Current Liabilities | 27.11% | 9.49% | 5.97% | 36.78% |
| Long-term Liabilities | 0.00% | 0.00% | 0.00% | 9.58% |
| Total Liabilities | 27.11% | 9.49% | 5.97% | 46.36% |
| Net Worth | 72.89% | 90.51% | 94.03% | 53.64% |
| | | | | |
| Percent of Sales | | | | |
| Sales | 100.00% | 100.00% | 100.00% | 100.00% |
| Gross Margin | 71.46% | 75.46% | 78.65% | 100.00% |
| Selling, General & Administrative Expenses | 48.59% | 44.84% | 42.16% | 74.71% |
| Advertising Expenses | 0.00% | 0.00% | 0.00% | 0.48% |
| Profit Before Interest and Taxes | 30.49% | 40.83% | 48.65% | 5.37% |
| | | | | |
| Main Ratios | | | | |
| Current | 3.69 | 10.53 | 16.75 | 1.82 |
| Quick | 3.69 | 10.53 | 16.75 | 1.62 |
| Total Debt to Total Assets | 27.11% | 9.49% | 5.97% | 51.49% |
| Pre-tax Return on Net Worth | 106.84% | 75.13% | 59.18% | 7.25% |
| Pre-tax Return on Assets | 77.87% | 67.99% | 55.65% | 14.94% |
| | | | | |
| Additional Ratios | FY 2009 | FY 2010 | FY 2011 | |
| Net Profit Margin | 22.87% | 30.63% | 36.49% | n.a |
| Return on Equity | 80.13% | 56.35% | 44.39% | n.a |
| | | | | |
| Activity Ratios | | | | |
| Accounts Payable Turnover | 7.26 | 12.17 | 12.17 | n.a |
| Payment Days | 27 | 38 | 29 | n.a |
| Total Asset Turnover | 2.55 | 1.67 | 1.14 | n.a |
| | | | | |
| Debt Ratios | | | | |
| Debt to Net Worth | 0.37 | 0.10 | 0.06 | n.a |
| Current Liab. to Liab. | 1.00 | 1.00 | 1.00 | n.a |
| | | | | |
| Liquidity Ratios | | | | |
| Net Working Capital | $55,368 | $126,832 | $228,061 | n.a |
| Interest Coverage | 0.00 | 0.00 | 0.00 | n.a |
| | | | | |
| Additional Ratios | | | | |
| Assets to Sales | 0.39 | 0.60 | 0.87 | n.a |
| Current Debt/Total Assets | 27% | 9% | 6% | n.a |
| Acid Test | 3.69 | 10.53 | 16.75 | n.a |
| Sales/Net Worth | 3.50 | 1.84 | 1.22 | n.a |
| Dividend Payout | 0.00 | 0.00 | 0.00 | n.a |
|
|
|
| Sales Forecast |
| | | May-08 | Jun-08 | Jul-08 | Aug-08 | Sep-08 | Oct-08 | Nov-08 | Dec-08 | Jan-09 | Feb-09 | Mar-09 | Apr-09 |
| Sales | | | | | | | | | | | | | |
| Assigned Auto | 0% | $4,792 | $4,792 | $4,792 | $4,792 | $4,792 | $4,792 | $4,792 | $4,792 | $4,792 | $4,792 | $4,792 | $4,792 |
| Assigned Fire | 0% | $1,750 | $1,750 | $1,750 | $1,750 | $1,750 | $1,750 | $1,750 | $1,750 | $1,750 | $1,750 | $1,750 | $1,750 |
| Produced Auto | 0% | $348 | $348 | $522 | $522 | $870 | $870 | $1,740 | $1,740 | $2,609 | $2,609 | $2,609 | $2,609 |
| Produced Fire | 0% | $162 | $162 | $243 | $243 | $405 | $405 | $810 | $810 | $1,215 | $1,215 | $1,215 | $1,215 |
| Produced Life | 0% | $376 | $376 | $563 | $563 | $939 | $939 | $1,878 | $1,878 | $2,817 | $2,817 | $2,817 | $2,817 |
| Produced Health | 0% | $56 | $56 | $84 | $84 | $141 | $141 | $282 | $282 | $422 | $422 | $422 | $422 |
| Produced Bank Loans & Credit Cards | 0% | $100 | $100 | $150 | $150 | $250 | $250 | $500 | $500 | $750 | $750 | $750 | $750 |
| Produced Bank Deposits | 0% | $20 | $20 | $30 | $30 | $50 | $50 | $100 | $100 | $150 | $150 | $150 | $150 |
| Mutual Funds | 0% | $56 | $56 | $84 | $84 | $140 | $140 | $280 | $280 | $420 | $420 | $420 | $420 |
| Semi-Monthly Auto | 0% | $982 | $982 | $982 | $982 | $982 | $982 | $982 | $982 | $982 | $982 | $982 | $982 |
| Semi-Monthly Fire | 0% | $328 | $328 | $328 | $328 | $328 | $328 | $328 | $328 | $328 | $328 | $328 | $328 |
| Semi-Monthly Life & Business
Development | 0% | $783 | $783 | $783 | $783 | $783 | $783 | $783 | $783 | $783 | $783 | $783 | $783 |
| Agent Scorecard Bonus | 0% | $0 | $0 | $0 | $0 | $0 | $0 | $0 | $0 | $0 | $0 | $0 | $34,500 |
| Total Sales | | $9,752 | $9,752 | $10,310 | $10,310 | $11,429 | $11,429 | $14,224 | $14,224 | $17,017 | $17,017 | $17,017 | $51,517 |
| | | | | | | | | | | | | | |
| Direct Cost of Sales | | May-08 | Jun-08 | Jul-08 | Aug-08 | Sep-08 | Oct-08 | Nov-08 | Dec-08 | Jan-09 | Feb-09 | Mar-09 | Apr-09 |
| Sales Agent Assistant Salary (Full-time) | | $1,387 | $1,387 | $1,387 | $1,387 | $1,387 | $1,387 | $1,387 | $1,387 | $1,387 | $1,387 | $1,387 | $1,387 |
| Sales Agent Assistant (Commission) | | $280 | $280 | $280 | $280 | $280 | $280 | $280 | $280 | $280 | $280 | $280 | $280 |
| Office Manager/Marketing (Full-time) | | $2,947 | $2,947 | $2,947 | $2,947 | $2,947 | $2,947 | $2,947 | $2,947 | $2,947 | $2,947 | $2,947 | $2,947 |
| Subtotal Direct Cost of Sales | | $4,613 | $4,613 | $4,613 | $4,613 | $4,613 | $4,613 | $4,613 | $4,613 | $4,613 | $4,613 | $4,613 | $4,613 |
|
| Personnel Plan |
| | | May-08 | Jun-08 | Jul-08 | Aug-08 | Sep-08 | Oct-08 | Nov-08 | Dec-08 | Jan-09 | Feb-09 | Mar-09 | Apr-09 |
| Agent | 0% | $0 | $0 | $0 | $0 | $0 | $0 | $0 | $0 | $0 | $0 | $0 | $0 |
| Sales Agent Assistant | 0% | $0 | $0 | $0 | $0 | $0 | $0 | $0 | $0 | $0 | $0 | $0 | $0 |
| Office Manager | 0% | $0 | $0 | $0 | $0 | $0 | $0 | $0 | $0 | $0 | $0 | $0 | $0 |
| Total People | | 3 | 3 | 3 | 3 | 3 | 3 | 3 | 3 | 3 | 3 | 3 | 3 |
| | | | | | | | | | | | | | |
| Total Payroll | | $0 | $0 | $0 | $0 | $0 | $0 | $0 | $0 | $0 | $0 | $0 | $0 |
|
| Pro Forma Profit and Loss |
| | | May-08 | Jun-08 | Jul-08 | Aug-08 | Sep-08 | Oct-08 | Nov-08 | Dec-08 | Jan-09 | Feb-09 | Mar-09 | Apr-09 |
| Sales | | $9,752 | $9,752 | $10,310 | $10,310 | $11,429 | $11,429 | $14,224 | $14,224 | $17,017 | $17,017 | $17,017 | $51,517 |
| Direct Cost of Sales | | $4,613 | $4,613 | $4,613 | $4,613 | $4,613 | $4,613 | $4,613 | $4,613 | $4,613 | $4,613 | $4,613 | $4,613 |
| Other Costs of Sales | | $0 | $0 | $0 | $0 | $0 | $0 | $0 | $0 | $0 | $0 | $0 | $0 |
| | | ------------ | ------------ | ------------ | ------------ | ------------ | ------------ | ------------ | ------------ | ------------ | ------------ | ------------ | ------------ |
| Total Cost of Sales | | $4,613 | $4,613 | $4,613 | $4,613 | $4,613 | $4,613 | $4,613 | $4,613 | $4,613 | $4,613 | $4,613 | $4,613 |
| | | | | | | | | | | | | | |
| Gross Margin | | $5,139 | $5,139 | $5,697 | $5,697 | $6,816 | $6,816 | $9,611 | $9,611 | $12,404 | $12,404 | $12,404 | $46,904 |
| Gross Margin % | | 52.69% | 52.69% | 55.25% | 55.25% | 59.63% | 59.63% | 67.57% | 67.57% | 72.89% | 72.89% | 72.89% | 91.05% |
| | | | | | | | | | | | | | |
| | | | | | | | | | | | | | |
| Expenses | | | | | | | | | | | | | |
| Payroll | | $0 | $0 | $0 | $0 | $0 | $0 | $0 | $0 | $0 | $0 | $0 | $0 |
| Marketing/Promotion | | $1,667 | $1,667 | $1,667 | $1,667 | $1,667 | $1,667 | $1,667 | $1,667 | $1,667 | $1,667 | $1,667 | $1,667 |
| Depreciation | | $0 | $0 | $0 | $0 | $0 | $0 | $0 | $0 | $0 | $0 | $0 | $0 |
| Employee Benefits | | $458 | $458 | $458 | $458 | $458 | $458 | $458 | $458 | $458 | $458 | $458 | $458 |
| Payroll Taxes | | $542 | $542 | $542 | $542 | $542 | $542 | $542 | $542 | $542 | $542 | $542 | $542 |
| Rent | | $1,800 | $1,800 | $1,800 | $1,800 | $1,800 | $1,800 | $1,800 | $1,800 | $1,800 | $1,800 | $1,800 | $1,800 |
| Utilities | | $250 | $250 | $250 | $250 | $250 | $250 | $250 | $250 | $250 | $250 | $250 | $250 |
| Office Supplies | | $250 | $250 | $250 | $250 | $250 | $250 | $250 | $250 | $250 | $250 | $250 | $250 |
| Professional Services | | $50 | $50 | $50 | $50 | $50 | $50 | $50 | $50 | $50 | $50 | $50 | $50 |
| Insurance | | $142 | $142 | $142 | $142 | $142 | $142 | $142 | $142 | $142 | $142 | $142 | $142 |
| Education/Training | 15% | $60 | $60 | $60 | $60 | $60 | $60 | $60 | $60 | $60 | $60 | $60 | $60 |
| Telephone/DSL/Cell | | $208 | $208 | $208 | $208 | $208 | $208 | $208 | $208 | $208 | $208 | $208 | $208 |
| Cell Phone | | $60 | $60 | $60 | $60 | $60 | $60 | $60 | $60 | $60 | $60 | $60 | $60 |
| Office Furniture | | $167 | $167 | $167 | $167 | $167 | $167 | $167 | $167 | $167 | $167 | $167 | $167 |
| Postage | | $250 | $250 | $250 | $250 | $250 | $250 | $250 | $250 | $250 | $250 | $250 | $250 |
| Auto | | $417 | $417 | $417 | $417 | $417 | $417 | $417 | $417 | $417 | $417 | $417 | $417 |
| Travel | | $83 | $83 | $83 | $83 | $83 | $83 | $83 | $83 | $83 | $83 | $83 | $83 |
| Meals/Entertainment | | $100 | $100 | $100 | $100 | $100 | $100 | $100 | $100 | $100 | $100 | $100 | $100 |
| Office Cleaning | | $60 | $60 | $60 | $60 | $60 | $60 | $60 | $60 | $60 | $60 | $60 | $60 |
| Office Maintenance & Repairs | | $60 | $60 | $60 | $60 | $60 | $60 | $60 | $60 | $60 | $60 | $60 | $60 |
| | | ------------ | ------------ | ------------ | ------------ | ------------ | ------------ | ------------ | ------------ | ------------ | ------------ | ------------ | ------------ |
| Total Operating Expenses | | $6,623 | $6,623 | $6,623 | $6,623 | $6,623 | $6,623 | $6,623 | $6,623 | $6,623 | $6,623 | $6,623 | $6,623 |
| | | | | | | | | | | | | | |
| Profit Before Interest and Taxes | | ($1,485) | ($1,485) | ($927) | ($927) | $192 | $192 | $2,987 | $2,987 | $5,780 | $5,780 | $5,780 | $40,280 |
| EBITDA | | ($1,485) | ($1,485) | ($927) | ($927) | $192 | $192 | $2,987 | $2,987 | $5,780 | $5,780 | $5,780 | $40,280 |
| Interest Expense | | $0 | $0 | $0 | $0 | $0 | $0 | $0 | $0 | $0 | $0 | $0 | $0 |
| Taxes Incurred | | ($371) | ($371) | ($232) | ($232) | $48 | $48 | $747 | $747 | $1,445 | $1,445 | $1,445 | $10,070 |
| | | | | | | | | | | | | | |
| Net Profit | | ($1,114) | ($1,114) | ($695) | ($695) | $144 | $144 | $2,240 | $2,240 | $4,335 | $4,335 | $4,335 | $30,210 |
| Net Profit/Sales | | -11.42% | -11.42% | -6.74% | -6.74% | 1.26% | 1.26% | 15.75% | 15.75% | 25.48% | 25.48% | 25.48% | 58.64% |
|
| Pro Forma Cash Flow |
| | | May-08 | Jun-08 | Jul-08 | Aug-08 | Sep-08 | Oct-08 | Nov-08 | Dec-08 | Jan-09 | Feb-09 | Mar-09 | Apr-09 |
| Cash Received | | | | | | | | | | | | | |
| | | | | | | | | | | | | | |
| Cash from Operations | | | | | | | | | | | | | |
| Cash Sales | | $9,752 | $9,752 | $10,310 | $10,310 | $11,429 | $11,429 | $14,224 | $14,224 | $17,017 | $17,017 | $17,017 | $51,517 |
| Subtotal Cash from Operations | | $9,752 | $9,752 | $10,310 | $10,310 | $11,429 | $11,429 | $14,224 | $14,224 | $17,017 | $17,017 | $17,017 | $51,517 |
| | | | | | | | | | | | | | |
| Additional Cash Received | | | | | | | | | | | | | |
| Sales Tax, VAT, HST/GST Received | 0.00% | $0 | $0 | $0 | $0 | $0 | $0 | $0 | $0 | $0 | $0 | $0 | $0 |
| New Current Borrowing | | $0 | $0 | $0 | $0 | $0 | $0 | $0 | $0 | $0 | $0 | $0 | $0 |
| New Other Liabilities (interest-free) | | $0 | $0 | $0 | $0 | $0 | $0 | $0 | $0 | $0 | $0 | $0 | $0 |
| New Long-term Liabilities | | $0 | $0 | $0 | $0 | $0 | $0 | $0 | $0 | $0 | $0 | $0 | $0 |
| Sales of Other Current Assets | | $0 | $0 | $0 | $0 | $0 | $0 | $0 | $0 | $0 | $0 | $0 | $0 |
| Sales of Long-term Assets | | $0 | $0 | $0 | $0 | $0 | $0 | $0 | $0 | $0 | $0 | $0 | $0 |
| New Investment Received | | $0 | $0 | $0 | $0 | $0 | $0 | $0 | $0 | $0 | $0 | $0 | $0 |
| Subtotal Cash Received | | $9,752 | $9,752 | $10,310 | $10,310 | $11,429 | $11,429 | $14,224 | $14,224 | $17,017 | $17,017 | $17,017 | $51,517 |
| | | | | | | | | | | | | | |
| Expenditures | | May-08 | Jun-08 | Jul-08 | Aug-08 | Sep-08 | Oct-08 | Nov-08 | Dec-08 | Jan-09 | Feb-09 | Mar-09 | Apr-09 |
| | | | | | | | | | | | | | |
| Expenditures from Operations | | | | | | | | | | | | | |
| Cash Spending | | $0 | $0 | $0 | $0 | $0 | $0 | $0 | $0 | $0 | $0 | $0 | $0 |
| Bill Payments | | $362 | $10,865 | $10,870 | $11,005 | $11,014 | $11,285 | $11,308 | $11,983 | $12,007 | $12,682 | $12,682 | $12,969 |
| Subtotal Spent on Operations | | $362 | $10,865 | $10,870 | $11,005 | $11,014 | $11,285 | $11,308 | $11,983 | $12,007 | $12,682 | $12,682 | $12,969 |
| | | | | | | | | | | | | | |
| Additional Cash Spent | | | | | | | | | | | | | |
| Sales Tax, VAT, HST/GST Paid Out | | $0 | $0 | $0 | $0 | $0 | $0 | $0 | $0 | $0 | $0 | $0 | $0 |
| Principal Repayment of Current Borrowing | | $0 | $0 | $0 | $0 | $0 | $0 | $0 | $0 | $0 | $0 | $0 | $0 |
| Other Liabilities Principal Repayment | | $0 | $0 | $0 | $0 | $0 | $0 | $0 | $0 | $0 | $0 | $0 | $0 |
| Long-term Liabilities Principal Repayment | | $0 | $0 | $0 | $0 | $0 | $0 | $0 | $0 | $0 | $0 | $0 | $0 |
| Purchase Other Current Assets | | $0 | $0 | $0 | $0 | $0 | $0 | $0 | $0 | $0 | $0 | $0 | $0 |
| Purchase Long-term Assets | | $0 | $0 | $0 | $0 | $0 | $0 | $0 | $0 | $0 | $0 | $0 | $0 |
| Dividends | | $0 | $0 | $0 | $0 | $0 | $0 | $0 | $0 | $0 | $0 | $0 | $0 |
| Subtotal Cash Spent | | $362 | $10,865 | $10,870 | $11,005 | $11,014 | $11,285 | $11,308 | $11,983 | $12,007 | $12,682 | $12,682 | $12,969 |
| | | | | | | | | | | | | | |
| Net Cash Flow | | $9,390 | ($1,114) | ($560) | ($695) | $415 | $144 | $2,916 | $2,240 | $5,010 | $4,335 | $4,335 | $38,548 |
| Cash Balance | | $20,390 | $19,276 | $18,716 | $18,021 | $18,436 | $18,580 | $21,496 | $23,736 | $28,746 | $33,081 | $37,417 | $75,964 |
|
| Pro Forma Balance Sheet |
| | | May-08 | Jun-08 | Jul-08 | Aug-08 | Sep-08 | Oct-08 | Nov-08 | Dec-08 | Jan-09 | Feb-09 | Mar-09 | Apr-09 |
| Assets | Starting Balances | | | | | | | | | | | | |
| | | | | | | | | | | | | | |
| Current Assets | | | | | | | | | | | | | |
| Cash | $11,000 | $20,390 | $19,276 | $18,716 | $18,021 | $18,436 | $18,580 | $21,496 | $23,736 | $28,746 | $33,081 | $37,417 | $75,964 |
| Other Current Assets | $0 | $0 | $0 | $0 | $0 | $0 | $0 | $0 | $0 | $0 | $0 | $0 | $0 |
| Total Current Assets | $11,000 | $20,390 | $19,276 | $18,716 | $18,021 | $18,436 | $18,580 | $21,496 | $23,736 | $28,746 | $33,081 | $37,417 | $75,964 |
| | | | | | | | | | | | | | |
| Long-term Assets | | | | | | | | | | | | | |
| Long-term Assets | $0 | $0 | $0 | $0 | $0 | $0 | $0 | $0 | $0 | $0 | $0 | $0 | $0 |
| Accumulated Depreciation | $0 | $0 | $0 | $0 | $0 | $0 | $0 | $0 | $0 | $0 | $0 | $0 | $0 |
| Total Long-term Assets | $0 | $0 | $0 | $0 | $0 | $0 | $0 | $0 | $0 | $0 | $0 | $0 | $0 |
| Total Assets | $11,000 | $20,390 | $19,276 | $18,716 | $18,021 | $18,436 | $18,580 | $21,496 | $23,736 | $28,746 | $33,081 | $37,417 | $75,964 |
| | | | | | | | | | | | | | |
| Liabilities and Capital | | May-08 | Jun-08 | Jul-08 | Aug-08 | Sep-08 | Oct-08 | Nov-08 | Dec-08 | Jan-09 | Feb-09 | Mar-09 | Apr-09 |
| | | | | | | | | | | | | | |
| Current Liabilities | | | | | | | | | | | | | |
| Accounts Payable | $0 | $10,503 | $10,503 | $10,638 | $10,638 | $10,909 | $10,909 | $11,584 | $11,584 | $12,259 | $12,259 | $12,259 | $20,597 |
| Current Borrowing | $0 | $0 | $0 | $0 | $0 | $0 | $0 | $0 | $0 | $0 | $0 | $0 | $0 |
| Other Current Liabilities | $0 | $0 | $0 | $0 | $0 | $0 | $0 | $0 | $0 | $0 | $0 | $0 | $0 |
| Subtotal Current Liabilities | $0 | $10,503 | $10,503 | $10,638 | $10,638 | $10,909 | $10,909 | $11,584 | $11,584 | $12,259 | $12,259 | $12,259 | $20,597 |
| | | | | | | | | | | | | | |
| Long-term Liabilities | $0 | $0 | $0 | $0 | $0 | $0 | $0 | $0 | $0 | $0 | $0 | $0 | $0 |
| Total Liabilities | $0 | $10,503 | $10,503 | $10,638 | $10,638 | $10,909 | $10,909 | $11,584 | $11,584 | $12,259 | $12,259 | $12,259 | $20,597 |
| | | | | | | | | | | | | | |
| Paid-in Capital | $21,600 | $21,600 | $21,600 | $21,600 | $21,600 | $21,600 | $21,600 | $21,600 | $21,600 | $21,600 | $21,600 | $21,600 | $21,600 |
| Retained Earnings | ($10,600) | ($10,600) | ($10,600) | ($10,600) | ($10,600) | ($10,600) | ($10,600) | ($10,600) | ($10,600) | ($10,600) | ($10,600) | ($10,600) | ($10,600) |
| Earnings | $0 | ($1,114) | ($2,227) | ($2,922) | ($3,617) | ($3,473) | ($3,329) | ($1,088) | $1,152 | $5,487 | $9,822 | $14,158 | $44,368 |
| Total Capital | $11,000 | $9,886 | $8,773 | $8,078 | $7,383 | $7,527 | $7,671 | $9,912 | $12,152 | $16,487 | $20,822 | $25,158 | $55,368 |
| Total Liabilities and Capital | $11,000 | $20,390 | $19,276 | $18,716 | $18,021 | $18,436 | $18,580 | $21,496 | $23,736 | $28,746 | $33,081 | $37,417 | $75,964 |
| | | | | | | | | | | | | | |
| Net Worth | $11,000 | $9,886 | $8,773 | $8,078 | $7,383 | $7,527 | $7,671 | $9,912 | $12,152 | $16,487 | $20,822 | $25,158 | $55,368 |
|
| General Assumptions |
| | | May-08 | Jun-08 | Jul-08 | Aug-08 | Sep-08 | Oct-08 | Nov-08 | Dec-08 | Jan-09 | Feb-09 | Mar-09 | Apr-09 |
| Plan Month | | 1 | 2 | 3 | 4 | 5 | 6 | 7 | 8 | 9 | 10 | 11 | 12 |
| Current Interest Rate | | 8.25% | 8.25% | 8.25% | 8.25% | 8.25% | 8.25% | 8.25% | 8.25% | 8.25% | 8.25% | 8.25% | 8.25% |
| Long-term Interest Rate | | 8.25% | 8.25% | 8.25% | 8.25% | 8.25% | 8.25% | 8.25% | 8.25% | 8.25% | 8.25% | 8.25% | 8.25% |
| Tax Rate | | 25.00% | 25.00% | 25.00% | 25.00% | 25.00% | 25.00% | 25.00% | 25.00% | 25.00% | 25.00% | 25.00% | 25.00% |
| Other | | 0 | 0 | 0 | 0 | 0 | 0 | 0 | 0 | 0 | 0 | 0 | 0 |
|
|